# HDL Coder Examples
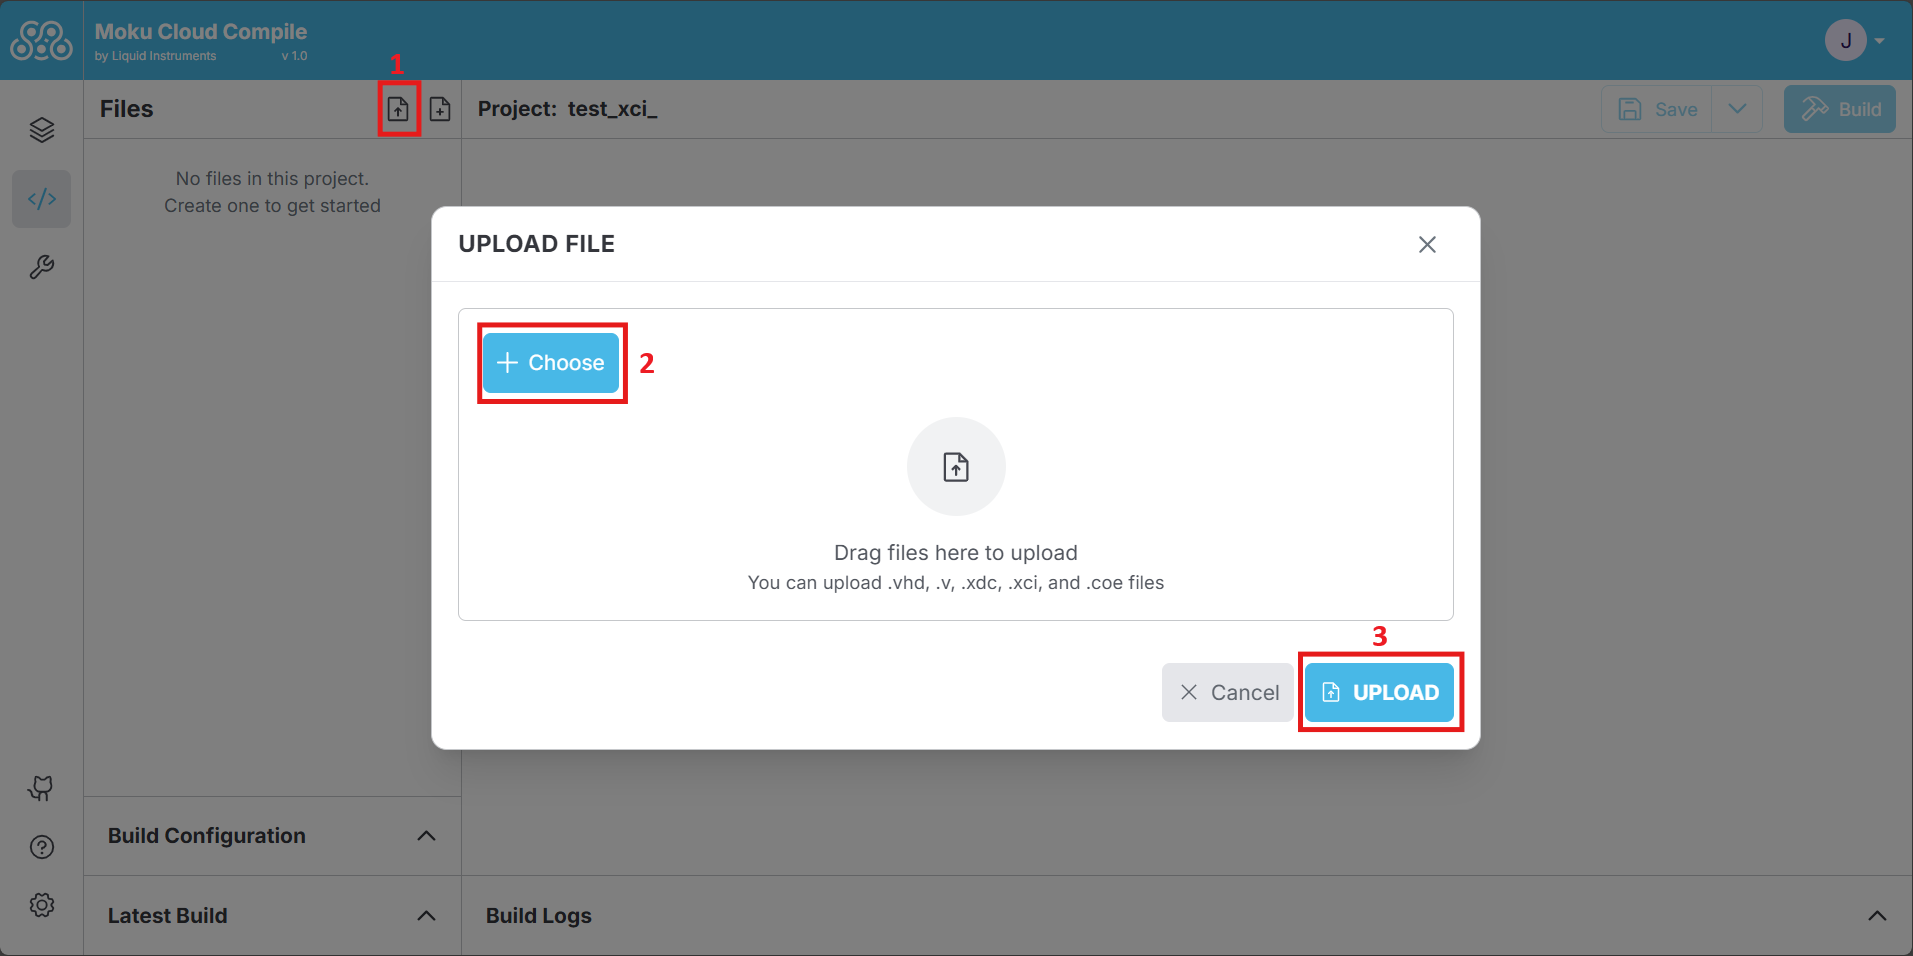
These examples were written with Mathworks's HDL Coder (opens new window). The generated HDL files were then compiled using Moku Compile and deployed on the device.
TIP
You can upload multiple files to Moku Compile.
# Simulink™ Boxcar averager
The lock-in amplifiers and the boxcar averager are two commonly used instruments to retrieve weak repetitive signals that are buried in noises. The lock-in amplifier is designed to filter out a narrow frequency band. For signals with low duty cycles, a significant amount of signal power is filtered out at the higher harmonics. The boxcar average is designed to gate the input signal in the time domain. It creates a matched filter for the repetitive input signal.
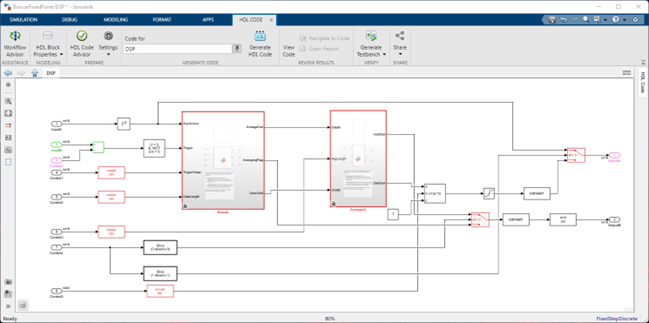
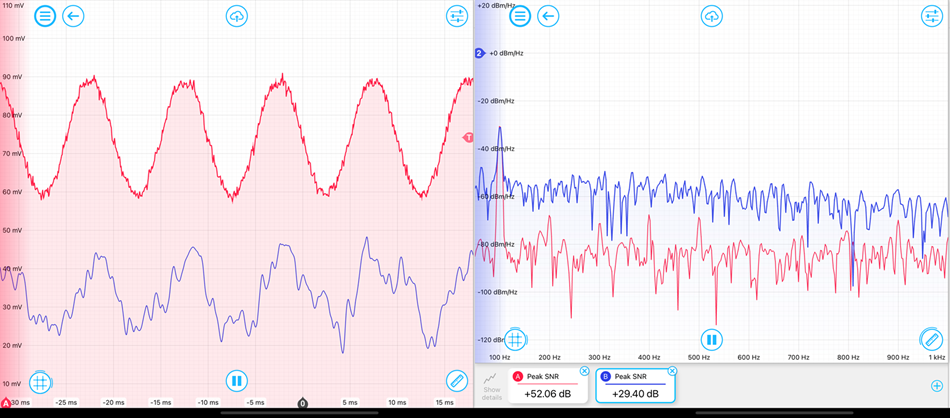
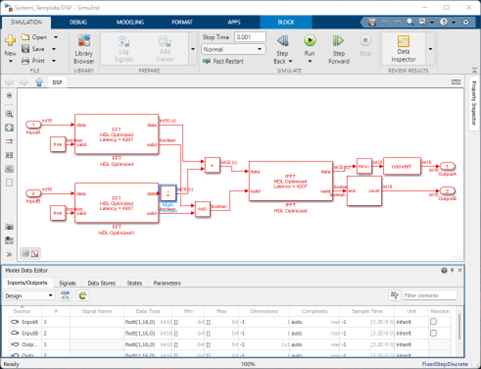
With the help of MATLAB, Simulink, and HDL Coder, a boxcar average was built and deployed on the Moku:Pro FPGA. A 100 kHz, 4 ns wide pulse train was peak height modulated sinusoidally and sent into both the lock-in amplifier and boxcar averager. A significant signal-to-noise improvement could be observed in both the time and frequency domains for the recovered signals, as can be seen in the results section below.
# Overview
The boxcar averager instrument takes two inputs: a signal input and a gate (trigger) input. It starts integrating the input signal for a certain number of samples after receiving a trigger, then sends it to a secondary integrator to average a certain number of triggers events before sending it to the output. The instrument can output the averaged output or direct signal feedthrough on output 1; a gate active signal or data valid signal on output 2.
# Getting Started
# Signals and Settings
| Port | Use |
|---|---|
| Input A | Signal |
| Input B | Trigger |
| Output A | Signal Bypass / Average Out |
| Output B | Output Valid / Gate Active |
| Register | Bits 31-16 | Bits 15-2 | Bit 1 | Bit 0 |
|---|---|---|---|---|
| Control0 | trigger level signed | |||
| Control1 | trigger delay unsigned | |||
| Control2 | gate length unsigned | |||
| Control3 | average length unsigned | |||
| Control4 | OutB sel | OutA sel | ||
| Control5 | integer gain unsigned | fractional gain unsigned |
# OutA Select
Bit value selecting the signal source for Output A, either the Boxcar averager
output (0), or directly outputting the input signal (1).
- Averager Output
- Signal Bypass
# OutB Select
Bit value selecting the signal source for Output B, a binary value indicating
either that the gate is active (0) or the averager output is valid (1).
- Gate Active
- Output Valid
# Setup procedure
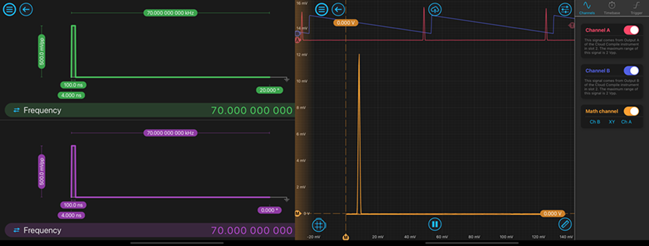
Feed signal into Input1 and trigger into Input2. Set trigger level to the appropriate trigger level. Set trigger delay to 8 as an initial guess. Set gate length to 8 as an initial guess. Set OutB sel to 1 to output the gating waveform on Output B, which will allow the gate and waveform to be viewed together and aligned. Set integer gain to 1 and fractional gain to 0 for unity gain.
Monitor Outputs A and B and see if the boxcar is being triggered (the blue pulse train). Once a stable trigger is established, adjust trigger delay and gate length to align the gate.
Set OutB sel to 0 to switch that output back to output the valid window. The instrument should now output the gated signal. Then, increase the gain via integer gain and fractional gain to reduce quantization error. Further optimization can be made by adjusting the gate length, average length, and trigger delay. Please note a large average length would result in a step-like response. A LPF is recommended after the output.
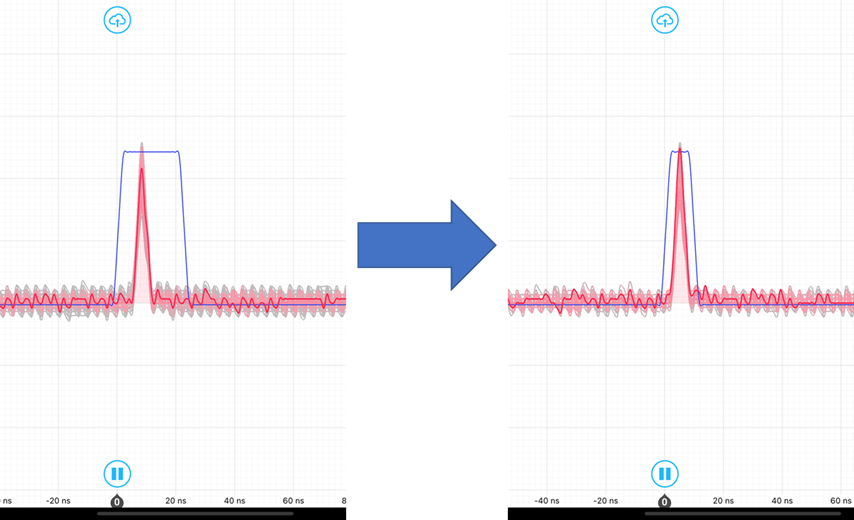
# Results
A significant improvement of SNR was observed in both time and frequency domain. Red trace was the output from boxcar and blue trace was the output from lock-in amplifier.
# Known Issues
- This instrument always runs at the maximum clock rate with no interpolation on the output. Slow repetition rate or long average length may result in quantized results. Consider adding a low-pass if needed.
- The dynamic range of the gain can be limited in some cases. The minimal non-zero gain may not prevent output from saturating in some cases.
- Not fully test for all possible parameter inputs.
- No pre-trigger option.
Boxcar | GitHub (opens new window)
# Simulink™ Cross-Correlator
Cross-correlation is a very common algorithm that is used to perform time delay analysis between two signals. This operation can be efficiently performed on an FPGA chip in the frequency domain. First, the input signals are converted from the time domain to the frequency domain via fast Fourier transform. Next, the complex conjugate is taken from one of the spectra. Then, the product of the two signals in the frequency domain is sent to an inverse Fourier transform to generate the cross-correlation result.
# Overview
This model generates the cross-correlation results on Output A, and the corresponding time delays on Output B. The cross-correlogram can be visualized on an oscilloscope with the X-Y mode.
# Getting Started
# Signals and Settings
| Port | Use |
|---|---|
| Input A | Signal 1 |
| Input B | Signal 2 |
| Output A | Cross Correlation |
| Output B | Time Delay |
# Results
← Advanced